For the previous post discussing SQL Trace see this post
For the TraceExceptions stored procedure presented in this post see my Traces project at Github.
Capturing all the exceptions that occur in the database engine has been proved to be very useful in my experience. Actually, when thinking about it, I realize most DBAs do not give database exceptions the appropriate attention in my opinion. There is so much valuable information there just needs to be picked up… some common scenarios would be after a version deployment when things go wrong or when there is any issue in the production server, just by examining the exceptions thrown by the database engine we can in many cases shorten troubleshooting significantly.
Looking at the ERRORLOG and the Windows Event Viewer is essential but not always enough.
As a DBA maintaining clients servers I feel obligated to be aware of any exception that takes place on the server.
Once you start capturing these exceptions they are always there handy for you to see, all that is needed is to hit the F5 (or Ctrl+E) on your keyboard.
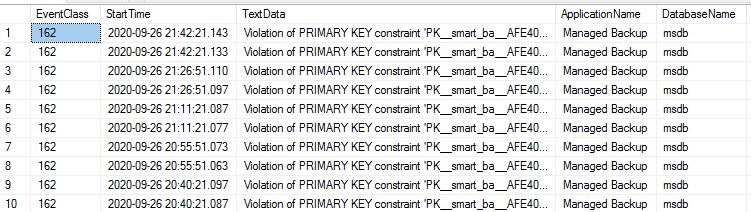
The way to capture database exceptions using SQL Trace is simple and includes setting a trace that captures Event Id 162 which is the “User Error Message”.
Here is how we do it with just 2 simple steps.
- create a stored procedure (TraceExceptions) that is coded to start a trace that captures exceptions only
- execute the stored procedure
Execute the procedure to start the trace
Note that this execution will result in a trace that captures the Event Id 162 to a file, the trace is defined to have 10 files sized 50 mb each in a FIFO algorithm so it will eventually consume 500 mb of disk space but never more than that.
EXEC DBA.dbo.TraceExceptions @MaxFileSize = 50, @FileCount = 10, @Path = 'D:\Traces\TraceExceptions';
Here is what I do to have the trace constantly running, I execute the TraceExceptions stored procedure using a startup procedure called Initialize, this results in a trace that is always up and running surviving restarts.
Here is how a query over the captured trace data looks like
Latest posts by Yaniv Etrogi (see all)
- Monitor AlwaysOn Availabilty Groups - July 6, 2023
- SQL Server – The secret index syntax - February 8, 2023
- Use .net SqlClient with Powershell to access data - January 25, 2023
- Use Powershell to find unused resources in Azure - August 5, 2022